
In order to instrument a charm with tracing telemetry, you will need to:
- Set up a model with
cos-lite:
juju add-model clite
juju deploy cos-lite --trust
See more: Charmhub |
cos-lite
- Deploy
tempo:
juju deploy tempo-k8s
See more: Charmhub |
tempo-k8s
- Integrate tempo with
cos-lite:
jhack imatrix fill
See more:
jhack, GitHub |jhack>imatrix>fill
Alternatively, you can integrate manually by:
juju integrate tempo:logging loki:logging
juju integrate tempo:ingress traefik:ingress
juju integrate grafana:grafana-source tempo:grafana-source
juju integrate prometheus:metrics-endpoint, tempo:metrics-endpoint
juju integrate grafana:grafana-dashboard, tempo:grafana-dashboard
juju integrate traefik:tracing, tempo:tracing
juju integrate prometheus:tracing, tempo:tracing
At some point there will be an overlay bundle to deploy cos-lite + tempo and integrate them; see this PR to follow the progress on the overlay.
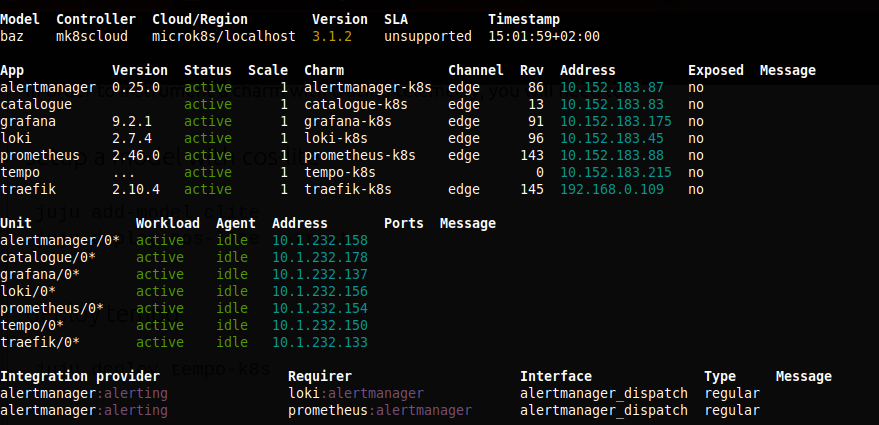
At this point you should have a working cos-lite plus tempo deployment; something like this:
- Fetch the
charm_tracingand thetracinglibs:
charmcraft fetch-lib charms.tempo-k8s.v1.charm_tracing
charmcraft fetch-lib charms.tempo-k8s.v0.tracing
See more:
charmcraft fetch-lib, Charmhub |tempo-k8s> Libraries >charm-tracing, Charmhub |tempo-k8s> Libraries >tracing
- Add an integration with
tempo:
# in charmcraft.yaml
provides:
  tracing:
    interface: tracing
    limit: 1
See more: File
charmcraft.yaml>provides
- Instrument your charm code:
# in /your/charm/project/src/charm.py
from charms.tempo_k8s.v0.charm_tracing import trace_charm
from charms.tempo_k8s.v0.tracing import TracingEndpointProvider

@trace_charm(tempo_endpoint="tempo")
class MyCharm(CharmBase):
    def __init__(self, *args):
        super().__init__(*args)
        # add a provider wrapper for the tracing endpoint
        self.tracing = TracingEndpointProvider(self)

    @property
    def tempo(self) -> Optional[str]:
        """The otlp http endpoint that will be used by the charm tracing instrumentation."""
        return self.tracing.otlp_http_endpoint
By default, the traces generated by this charm will be tagged with service name equal to the class name of the charm, so "MyCharm" in this case. You override this default by passing
service_name="foo" to trace_charm.
- Pack, deploy, and integrate your charm with
cos-lite:
charmcraft pack
juju deploy ./my-charm-operator_ubuntu-20.04-amd64.charm mycharm \
  $(yq eval '.resources | to_entries | map(select(.value.upstream-source != null) | "--resource " + .key + "=" + .value.upstream-source) | join(" ")' charmcraft.yaml)
juju integrate mycharm:tracing tempo-k8s:tracing
cos-lite is a kubernetes bundle. tempo is a Kubernetes charm.
See more:
charmcraft pack, Juju |juju deploy, Juju |juju integrate
- View the traces for the charm.
Open the Grafana dashboard in a browser (see here for more detailed instructions).
Next, navigate to the traces for your charm:
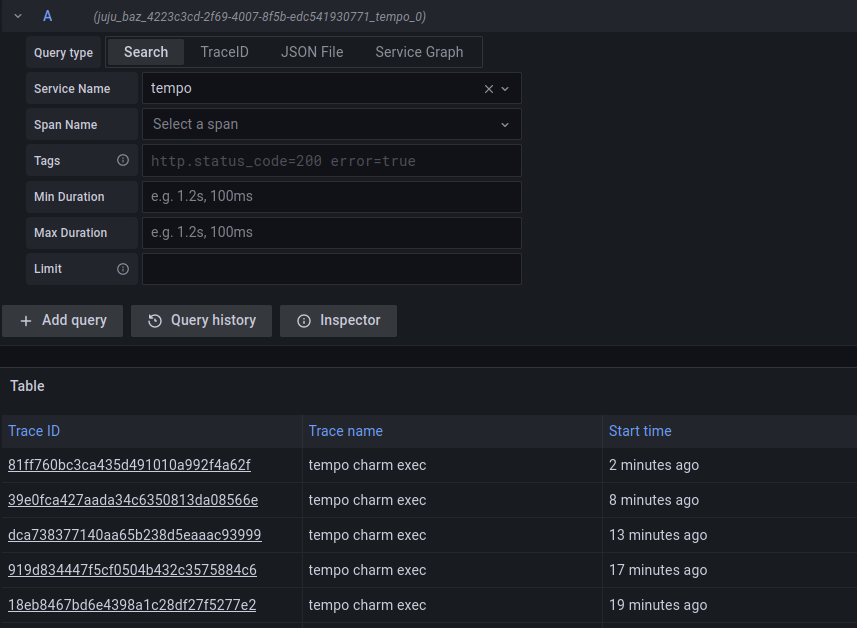
- go to
Exploreand select the Tempo datasource. - pick the
service_nameyou gave to MyCharm above (the default is the application name) to see the traces for that charm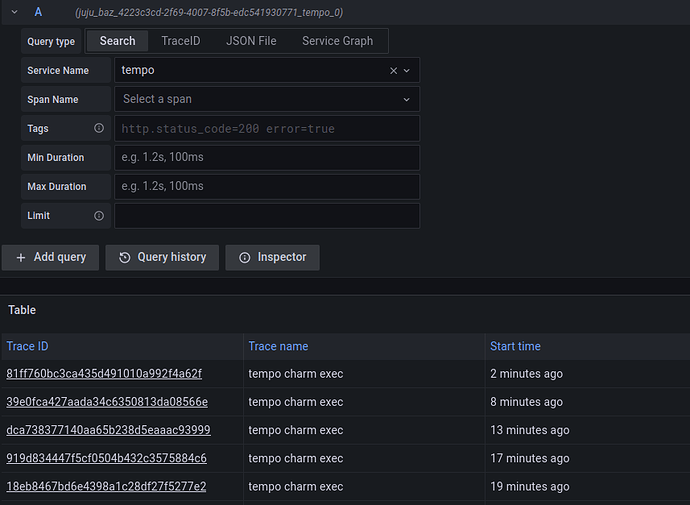
- click on a trace ID to visualize it. For example, this is the trace for an
update-statusevent on the Tempo charm itself: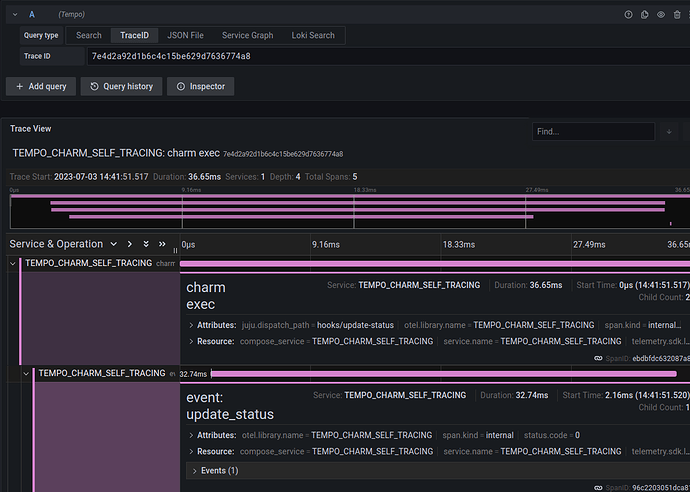

Mapping events to traces with jhack tail
jhack tail supports a -t option to show the trace IDs associated with a charm execution:
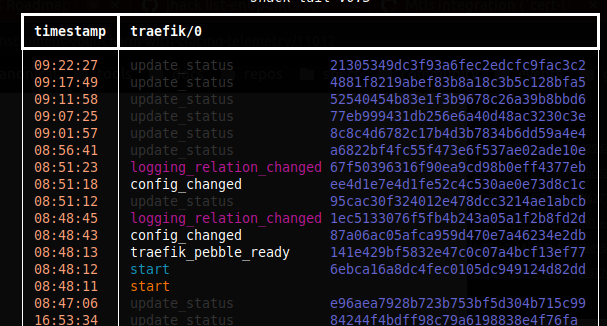
This means that you can tail a charm, grab the trace id from tail, put it in the grafana dashboard query and get to the trace in no time.